
Bristol property prices
The Bristol property market has entered the new year with renewed momentum, reflecting both national trends and a noticeable uplift in activity across all our offices.
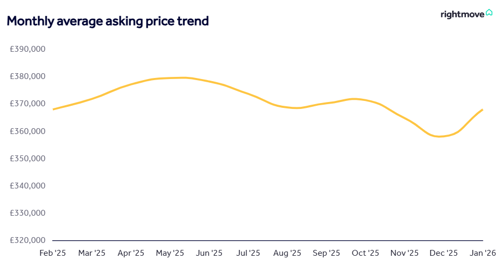
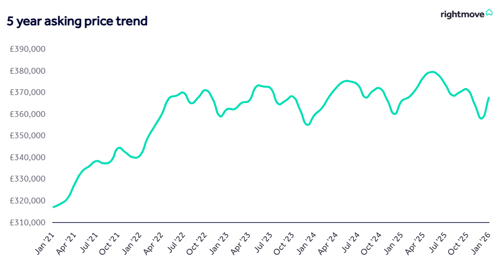
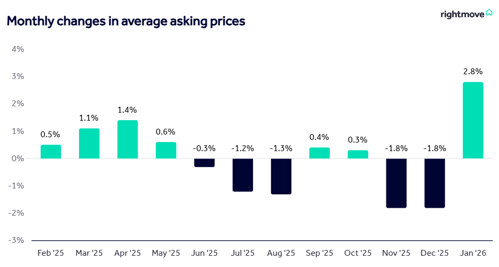
January has seen the average asking price of homes coming to market rise to £368,031, a 2.8% increase on December - the largest January jump on record and the biggest monthly rise since June 2015. National average prices now sit 0.5% higher than this time last year, signalling a rebound in confidence following the post‑Budget slowdown.
This strong start to 2026 has been fuelled by a surge in home-mover activity. Rightmove’s traditional Boxing Day bounce was more pronounced than ever, with the platform recording its busiest Boxing Day to date.
In the two weeks following Christmas, buyer demand climbed 57%, while newly listed homes rose 81%, showing clear signs of pent‑up energy returning to the market. Stock levels are higher than they have been at this point in the year since 2014, and with a third of homes currently for sale having undergone a price reduction, sellers should remain realistic when setting expectations.
Nonetheless, improved affordability supported by major lenders reducing rates and the average two‑year fixed mortgage reaching its lowest point since before the September 2022 - means many buyers are approaching 2026 with greater clarity and confidence.
Bristol, North Somerset and South Gloucestershire prices
There’s a twelve-year high number of homes for sale for this time of year, so buyers have lots of choice, and a third of properties that were already on the market for sale have had a price reduction. This means that sellers need to be realistic and balance the price they want to achieve with the likelihood of being able to find a buyer in their local market at that price. (Rightmove)


Get in touch with your local Ocean office for real‑time updates on what’s happening in your property market.
National
Average UK house prices continued to show steady but modest growth toward the end of 2025. The latest ONS figures report that the average UK property price stood at £269,862 in October 2025, up 1.7% year‑on‑year, although prices dipped slightly by 0.1% month‑on‑month. (Land Registry)
Property portal Rightmove recorded a larger‑than‑usual seasonal fall in December, with the average new seller asking price down 1.8% to £358,138 as the year closed—0.6% lower than December 2024. This sharper dip is attributed to seasonal slowing and the lingering uncertainty surrounding the Autumn Budget, though early signs point towards a potential post‑Christmas rebound.
Looking ahead, market forecasts suggest renewed momentum. Independent forecasts compiled by HM Treasury indicate that UK house prices are expected to grow modestly in 2026, with many analysts projecting increases of around 2%-3%, supported by easing mortgage rates, improving buyer affordability and stabilising economic conditions.
Outlook
House price trends: Evidence of stability and uneven growth across Bristol
Although national house‑price growth has slowed over the past 18 months, Bristol continues to demonstrate notable long‑term resilience. The latest data shows a city that has largely held its value through economic volatility, even while some property types diverge in performance.
Citywide Perspective
The most recent ONS release reports that the average house price in Bristol was £354,000 in October 2025, virtually unchanged from the revised October 2024 figure of £355,000.
Complementing this, updated Bristol market analysis from early 2026 confirms the average property price remains around £354,000, showing a broadly flat trend over the past year. (hoa.org.uk, ons.gov.uk) This stability is underscored by contrasting movements among different property types:
- Semi‑detached homes: Up 1.2% year‑on‑year (2024–2025).
- Flats: Down 2.6% year‑on‑year, highlighting a “two‑speed” market where houses outperform flats.
Bristol’s housing market remains one of the most resilient in the South West, with prices holding firm even as several UK regions have cooled. Momentum is still supported by tight supply, strong inward migration, strong employment data, university demand, and major regeneration schemes, Temple Quarter and Western Harbour to name one of many.
“It’s important to remember that among records and national trends, Great Britain’s housing market is made up of thousands of diverse local markets, each uniquely responding to market changes" Colleen Babcock, property expert at Rightmove
Home Valuation
Curious to know your home's sale or rental value?
We're here to help...